Patchmageddon? Or Not So Much
J.P. Morgan's thirty-page report says AI has collapsed the gap between disclosure and exploitation from a year to a day. The data behind that claim is solid. The conclusion most readers will draw from it — patch everything, faster — is not, and the breach data says why: this is a prioritization problem, not a speed problem.
The exploitability gap and the breach data throughout this post say something less alarming: fewer than 2% of disclosed vulnerabilities have ever driven real-world risk, and that concentration hasn't budged even as raw discovery volume exploded.
The fix isn't patching faster across the board — it's prioritization: pointing that speed at the vital few flaws that are actually reachable and actually exploited.

When J.P. Morgan publishes a thirty-page research report titled Patchmageddon, the security industry takes notice. Written by Michael Cembalest, Chairman of Market and Investment Strategy, alongside Global CISO Pat Opet and the bank's cybersecurity leadership, the report formalizes a thesis that has been building for a year: frontier AI is industrializing vulnerability discovery, collapsing exploitation timelines, and driving CVE growth to levels the old disclosure-and-patch cadence was never built to absorb.
I've been tracking the same shift from a different angle — the median-time-to-exploit curve sliding from roughly a year in 2021 down toward zero, and the bug-bounty pipeline drowning in AI-generated noise as a result. J.P. Morgan's report covers similar ground with a bank's resources behind it, and it's worth taking seriously. But it also invites a question its own data doesn't answer: does an explosion in disclosed vulnerabilities equate to existential enterprise risk? Pair the report's warnings with the breach data that's since come out, and the picture gets both scarier and more tractable at the same time.
Vulnerability discovery and exploit generation now run at machine speed — AI systems finding, chaining, and weaponizing flaws in hours. Enterprise remediation still runs at human speed — change control, regression testing, maintenance windows measured in months. The gap between those two clocks is the whole story.
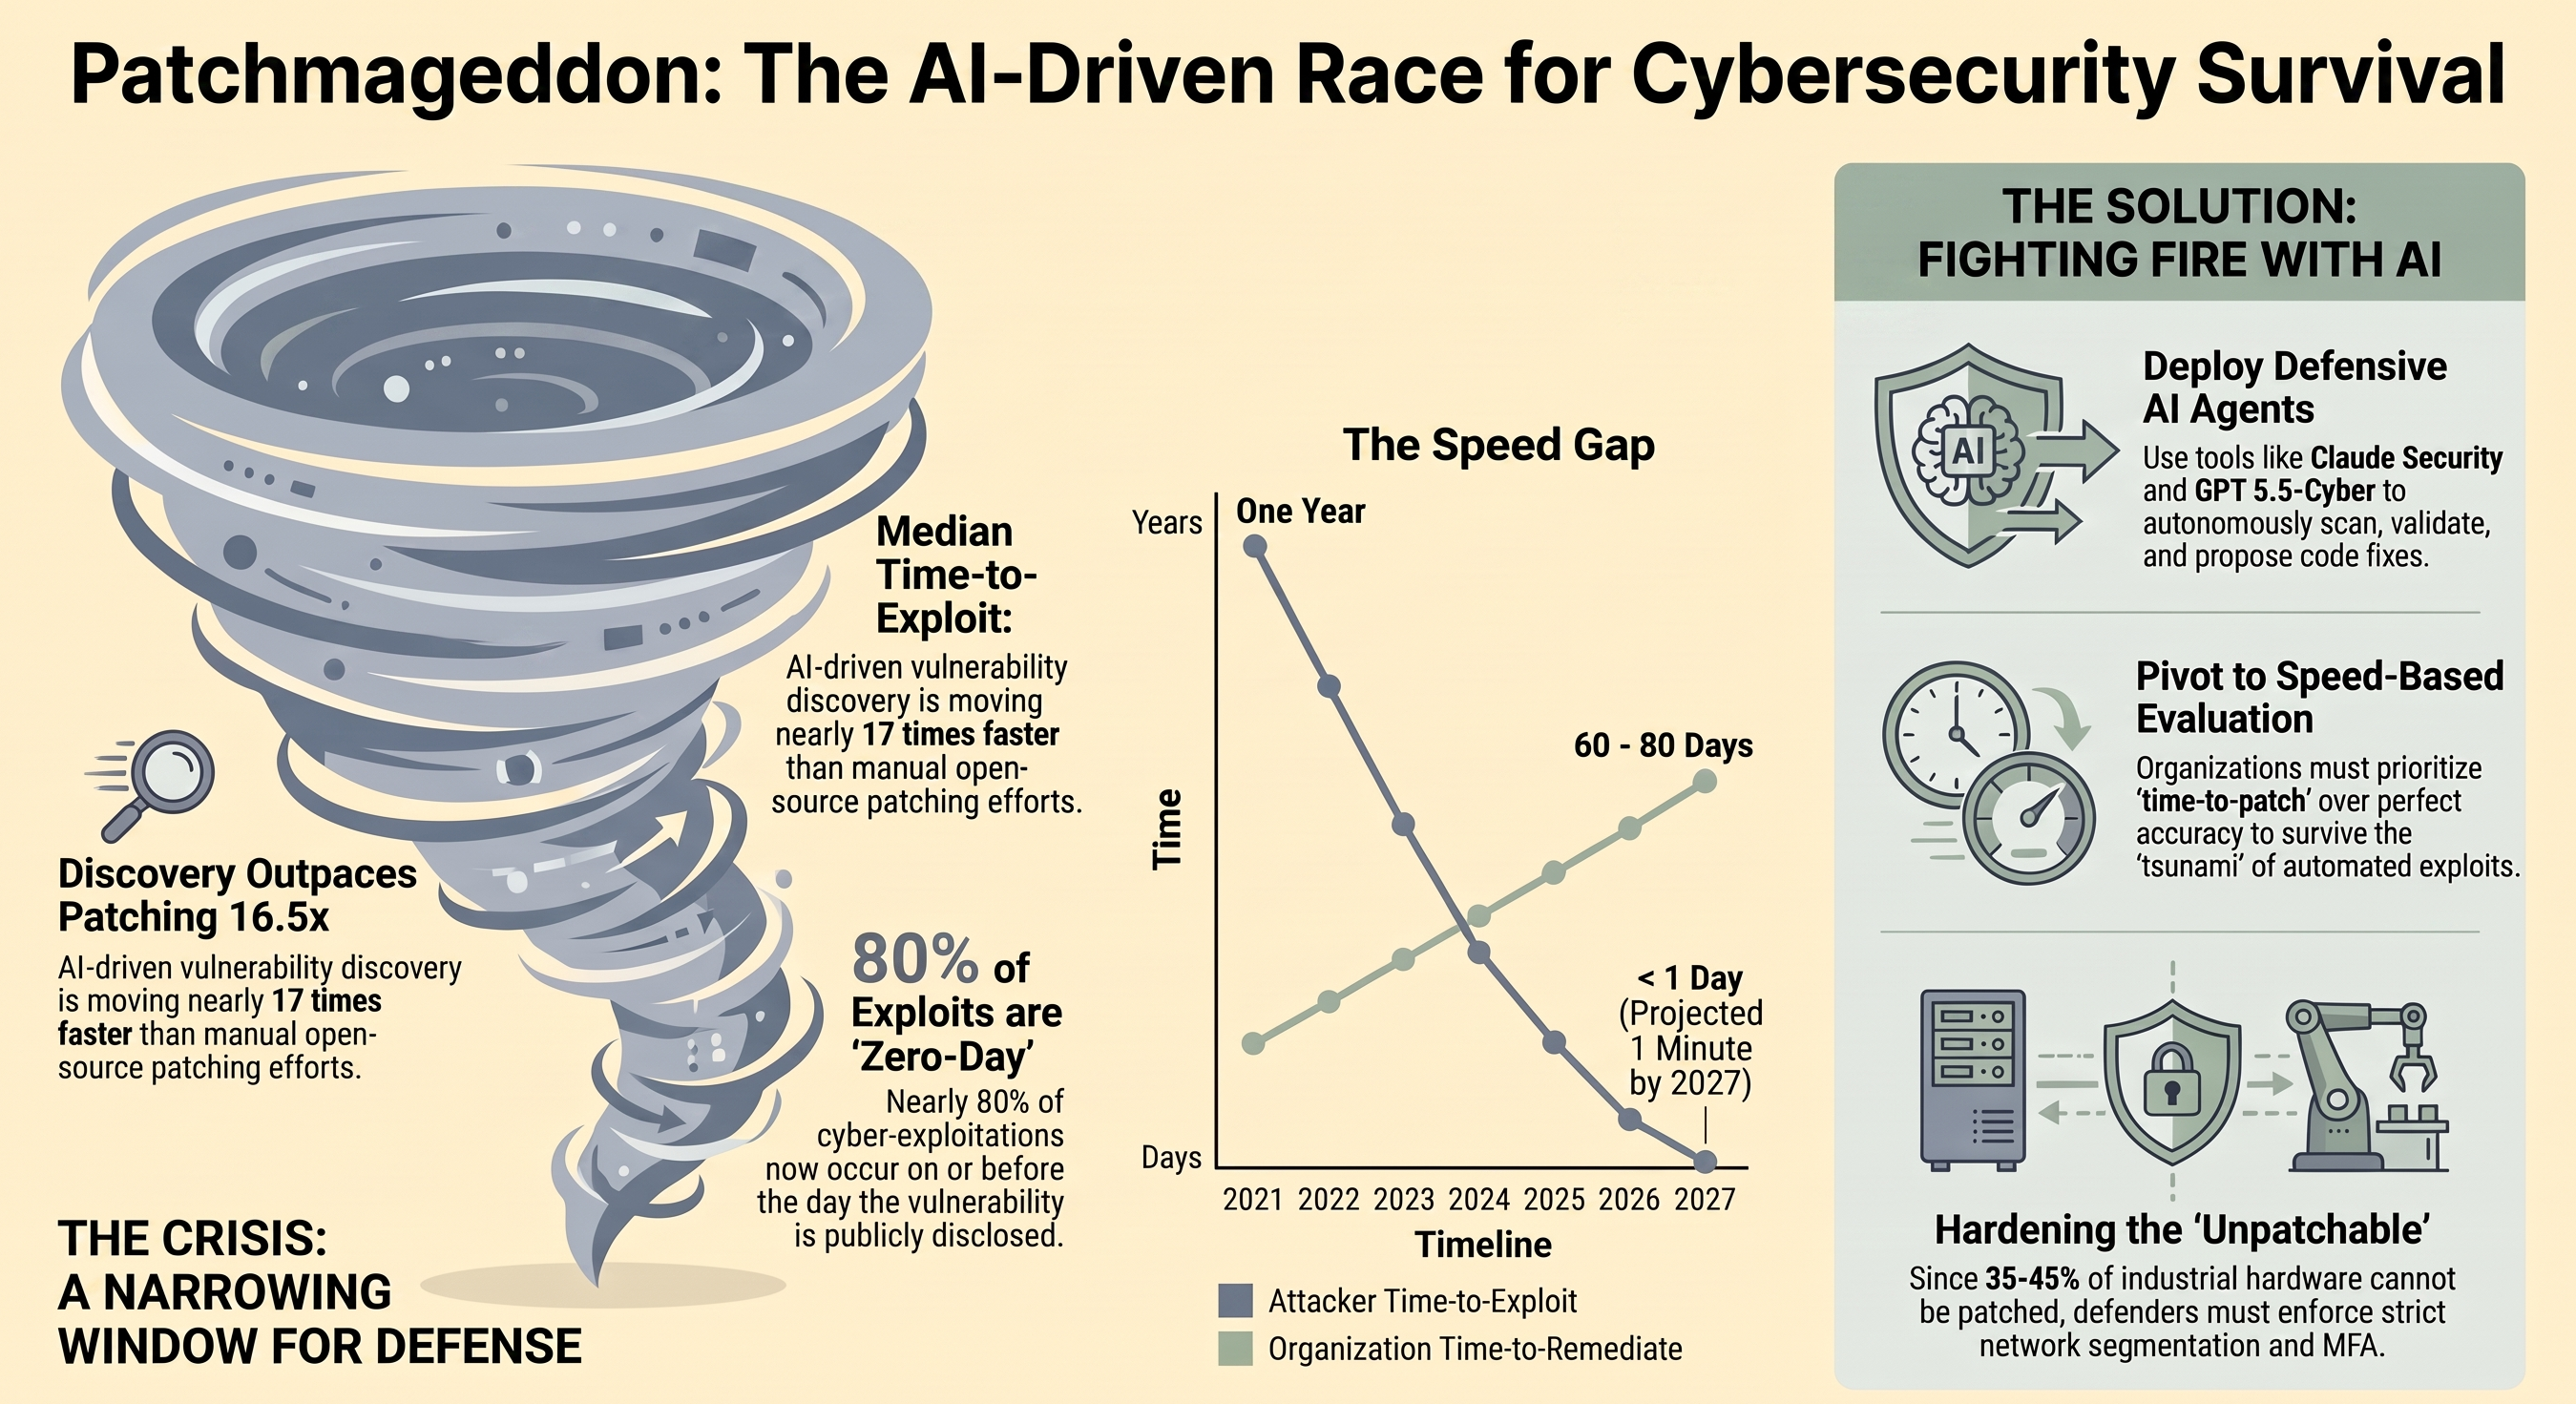
For twenty years, defenders operated on the assumption that vulnerability research was a human-constrained bottleneck: someone had to read the code, understand the bug class, and hand-craft an exploit. That assumption is dead. The interesting questions aren't whether the gap above is real, but what to do about it — and whether the disclosed-volume panic the report invites is even pointing at the right thing.
01 The Hard Data: Collapsing Timelines and the Patch Gap
Five numbers carry most of the argument's weight here, and they're worth isolating before turning to the charts that back them up.
The Five Numbers
The empirical core of J.P. Morgan's report is a widening divergence between attacker capability and defensive response:
- The disclosure surge. More than 48,000 vulnerabilities were disclosed in 2025 — roughly in line with independent CVE trackers — while only about 7,500 received a timely patch, per Mitiga's tracking.
- Collapsing time-to-exploit. The average window between disclosure and first confirmed in-the-wild exploitation has dropped to roughly a single day, with the median already at zero.
- Zero-day-dominant exploitation. Close to 80% of weaponized exploitation now happens on or before the day of public disclosure — attackers are no longer waiting for the advisory.
- The remediation drag. Mean time for an enterprise to test and deploy a patch has expanded past 90 days, moving in the opposite direction from the attacker's clock.
- The pre-patch breach. In roughly 60% of breaches, a working vendor patch already existed at the moment of initial compromise. The bottleneck wasn't the vendor. It was everything downstream of the vendor.
Two Clocks, Diverging
Put the two trend lines side by side and the shape of the problem is obvious — one curve heading toward zero, the other drifting upward:
Rate vs. Speed
None of this comes from one source. J.P. Morgan's report synthesizes work from Mitiga, Forescout, Sonatype, the UK AI Security Institute, independent researchers Sergej Epp — creator of the Zero Day Clock dashboard — and Josh Bressers, plus model evaluations published directly by Anthropic and OpenAI. That's a wide enough base of independent instrumentation that the top-line trend is hard to argue with, whatever you think of any single number in it.
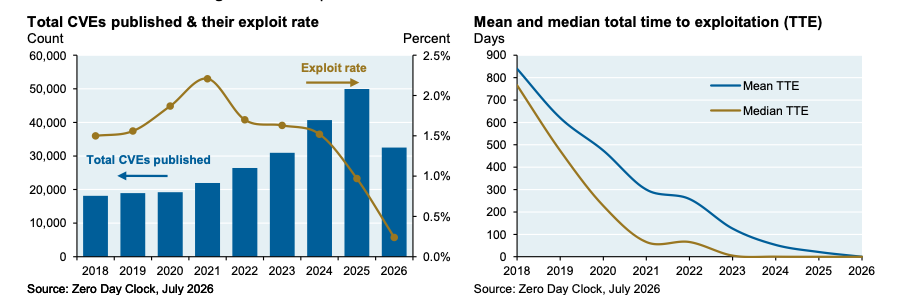
Two things are happening in that chart at once. The left panel's CVE bars climb every year while the exploit-rate line — the share of that growing pile ever weaponized — actually peaks around 2021 and falls after, because disclosure volume is outrunning exploitation volume. The right panel is the sharper story: mean and median time-to-exploitation both collapse from the better part of two years to near zero across the same window — the number J.P. Morgan's report leans on hardest. Rate and speed are answering different questions, and conflating them is most of what goes wrong in the "48,000 CVEs" framing.
More Things, Faster
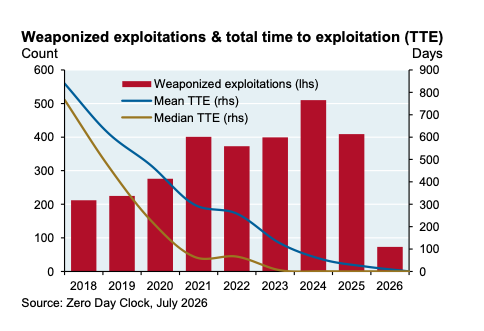
Figure 4 tells the volume side of the same story from a different angle: weaponized exploitations — confirmed attacks, not just published CVEs — more than doubled between 2018 and 2024, even as the TTE lines above keep falling toward zero. Attackers aren't exploiting a smaller number of things faster; they're exploiting more things, faster, at the same time. That combination is what makes the remediation-drag bullet above bite harder than the disclosure-surge bullet does on its own.
The Survival Curve
The two panels in Figure 5 pull in opposite directions, and both matter. The left one is the source of the 80%-and-climbing zero-day figure above: exploitation increasingly lands before or on disclosure day, not after. The right one behaves like a survival curve — for each cohort year, it plots what share of that year's CVEs have been exploited by a given number of days out, and every cohort levels off well under 100%, including the older ones that have had years to accumulate exploits.
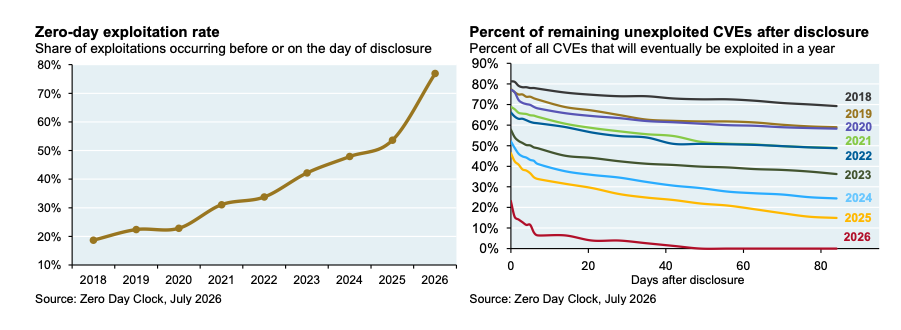
Read the newest cohorts carefully, though: 2025 and 2026 sit far below the rest mostly because they haven't had time to run yet, not necessarily because they're safer. It's the same shrinking-share-of-a-growing-pile pattern this post returns to under Understanding What's Exploited.
02 Frontier AI and Machine-Speed Discovery
The collapsing timelines in the last section have a specific cause: a new generation of models built or tuned specifically for security work, and the pipeline problems that follow once they start finding bugs faster than anyone can triage them.
The Models Doing the Work
The driver behind the shift is a new class of frontier models purpose-built or fine-tuned for security research — Anthropic's Claude Mythos Preview (built on the Fable 5 line) and OpenAI's GPT-5.5-Cyber, paired with tooling like Codex's security plugins. These aren't general-purpose assistants that happen to be decent at CTF problems; they're systems specifically evaluated on vulnerability discovery, and the numbers reflect it.
Frontier scale isn't the only lever, though. Cisco's 3-billion-parameter Antares matches frontier-level vulnerability-localization accuracy for under $1 a run versus roughly $141 for a leading proprietary model, and Google's cyber-specialized Gemini 3.5 Flash Cyber — built on Google's smallest, cheapest tier — found more V8 vulnerabilities than Claude Opus 4.6 did. A blog post on using small language models (SLMs) makes the fuller case: the durable edge in AI-driven discovery is the orchestration system wrapped around a model, not the model's parameter count.
The Triage Bottleneck
- Scale of discovery. During early access to Claude Mythos, Mozilla and Cloudflare were among the partners in Anthropic's Project Glasswing that each found hundreds of vulnerabilities in their own codebases — an order of magnitude beyond what previous-generation tooling surfaced. Across all Project Glasswing partners combined, the first month of deployment turned up more than 10,000 high- and critical-severity zero-days.
- The maintainer-side collapse. Discovery is only half the funnel. Through May 2026, Anthropic took 23,000 candidate findings to external review and triage; of the 3,900 deemed high- or critical-severity, only 530 were formally reported to upstream maintainers — and only 75 were patched. Tuskira Research found Mythos-driven discovery outpacing patching by 16.5×, even with maintainers acknowledging 90% of the reports. The bottleneck isn't the discovery; it's the human volunteer on the other end of the queue.
- Automated exploit synthesis. Writing a working exploit from a published patch is no longer a specialist's craft. Red teams have shown Mythos reverse-engineering a patch and producing a functional privilege-escalation exploit in under 24 hours, for a computational cost under $2,000, with no human in the loop.
- The open-source supply chain trap. Commercial software leans very heavily on open-source components — 96 to 99% of applications contain them — and more than 18 million open-source packages depend on a single primary maintainer. With roughly 95% of open-source vulnerabilities buried in indirect, transitive dependencies, those volunteer maintainers are now the point where an unmanageable volume of AI-generated bug reports actually lands.
That last point deserves more weight than the report gives it. A frontier model that finds real bugs faster than humans is a capability question. A frontier model that finds real bugs faster than a single unpaid maintainer can triage them is a staffing question, and staffing questions don't get solved by better AI on the discovery side — they get solved by AI, or something, on the triage side.
The Defensive Response
The Patchmageddon report spends its remediation chapter on exactly this: Claude Security patched 2,100 vulnerabilities in the weeks after launch, and OpenAI's Codex Security has scanned more than 30 million submissions across 30,000 codebases, with 70,000 discoveries marked repaired by human reviewers and another 500,000 auto-determined as repaired.
That is not a footnote to the panic thesis — it is the only answer shape that scales, and the report is more useful for putting it in writing than for the headline.
That's one pillar of a broader defensive architecture. A recent post traces the full four-pillar stack the defensive literature has converged on — harden, watch, contain, patch — along with the caution that belongs next to any autonomous-remediation number: stripped of a hint about where a bug lives, frontier models patch real zero-days correctly on fewer than 15% of cases; handed the location and nature up front, the best of them jumps to 95.7%. The gap between those two numbers is most of what "autonomous remediation" still has to prove.
03 Why Counting CVEs Isn't the Answer
The case against volume-driven panic starts with a simple observation about what a raw count actually measures.
The Vanity-Metric Problem
Here's where I think the report, read uncritically, leads people astray. Treating the raw explosion in CVE counts as an existential threat to corporate survival misunderstands how operational risk actually works. As security analyst Adrian Sanabria has pointed out, raw vulnerability counts have never been a reliable predictor of organizational failure — they're a count of things that could go wrong, not things that do.
That's the same figure this section arrives at from independent sources — a number so obvious the report itself has to stipulate it in passing, then bury it under a thirty-page case for exactly the kind of volume-driven panic that its own stipulation undercuts. The post isn't catching J.P. Morgan omitting the breach data; it's catching the report acknowledging it and pressing on anyway.
Vulnerable Does Not Imply Exploited
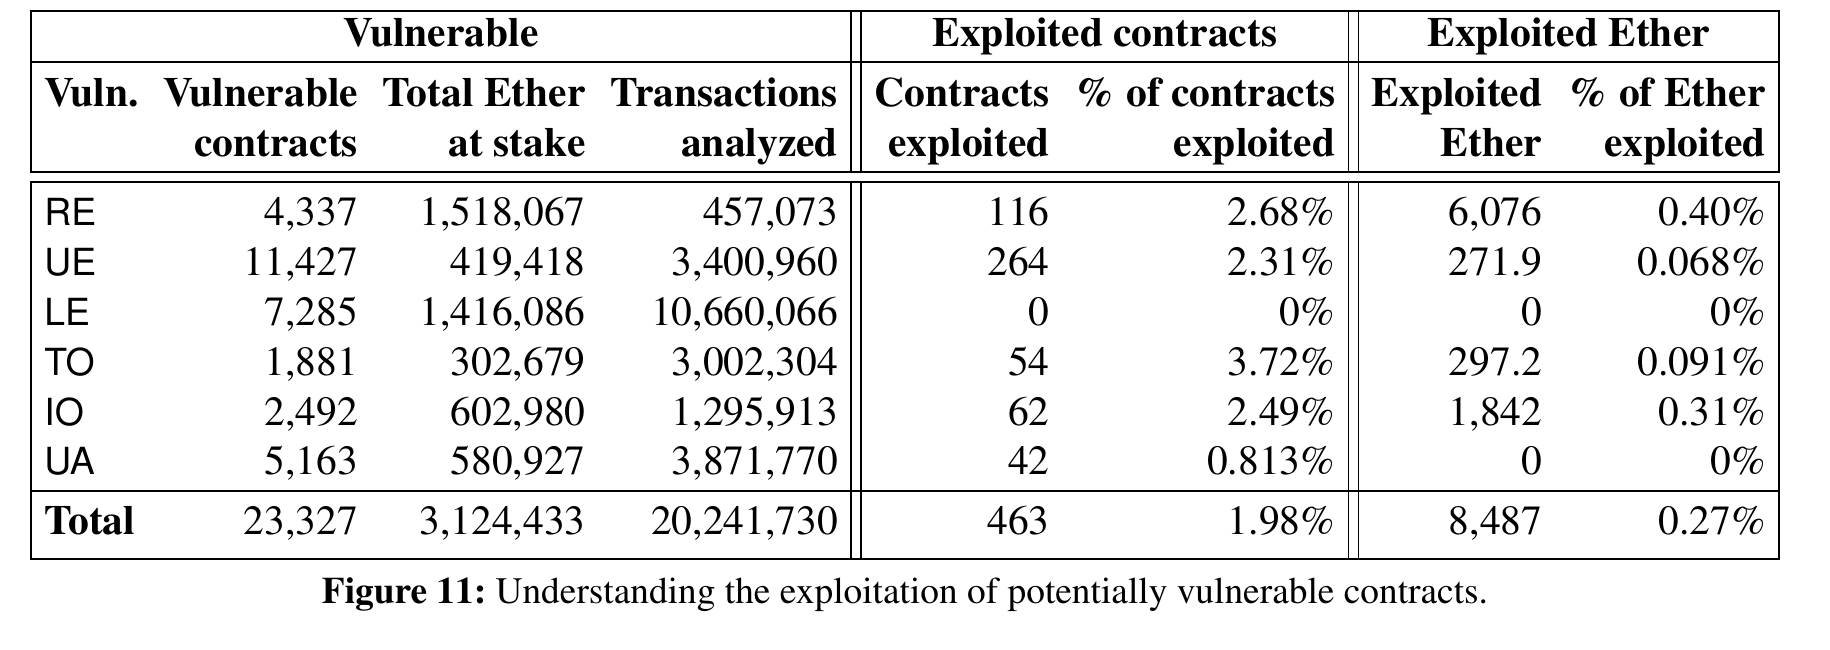
The academic grounding for this goes back further than the current panic. Daniel Perez and I surveyed 23,327 Ethereum contracts flagged as vulnerable by six academic detectors in Smart Contract Vulnerabilities: Vulnerable Does Not Imply Exploited (30th USENIX Security Symposium, 2021).
Despite the potential risk and financial advantages of exploitation, only 1.98% had ever actually been exploited — at most 8,487 ETH (~$1.7 million) out of the 3 million ETH (~$600 million) those detectors said was at risk, or 0.27% of the money supposedly on the table.
The gap wasn't random: the funds actually at risk were concentrated in a handful of contracts, while the rest of the flagged population was vulnerable on paper and functionally unexploitable — the same reachability gap the report cites today, three years before "reachability" was the word anyone used for it.
What Matters for Exploitability
Four mechanisms explain the gap:
- No dynamic reachability. Static analyzers routinely flag vulnerable components that are never loaded, invoked, or reached at runtime — and no one has ever gotten a proof-of-concept exploit to actually fire against them. The finding is real; the exposure isn't.
- Mitigating context. Internal segmentation, perimeter controls, and access boundaries frequently block the path to a vulnerable function long before an exploit could reach it.
- The metric trap. Teams that measure security performance strictly by "CVEs remediated" get exactly the behavior that metric rewards: engineers clear easy, low-risk tickets and leave complex, high-consequence architectural flaws untouched, because those don't move the count.
- Attacker risk calculus. Exploiting a live target isn't free for the attacker either — it risks attribution, law-enforcement attention, and burning a technique that still works elsewhere for a marginal payout. Attackers ration effort toward soft, reliable, low-consequence targets, not toward every contract or CVE a scanner happens to flag.
The finding held up under a much bigger microscope a few years later. Hu et al. re-ran the question in 2024 across 136,969 real-world contracts — six times the scale of the original study — using seven separate detectors. Of the 4,364 contracts flagged as vulnerable, 75.25% turned out to be unexploitable outright: false positives or code with no real security risk once you looked closer. Of the 1,080 that were genuinely exploitable, only 66 — 6% — were ever actually exploited.
Run the full funnel and roughly 1.5% of everything flagged as vulnerable ever got touched — a number that will look familiar by the time this post gets to VulnCheck and EPSS in the next section, and to Root Evidence's breach data two sections after that.
Smart contracts and enterprise software are about as different as codebases get, and the same shape of answer keeps showing up.
Exploits to Dollars
A third paper adds the missing piece: if presence doesn't equal exploitation, what actually turns a flagged vulnerability into a real loss?
Rezaei, Eshghie, et al.'s 2025 SoK stays in the same domain as Perez and Livshits — smart contracts, where the presence-versus-exploitation tension is sharpest of all, because an exploit isn't a theoretical risk score, it's money leaving the contract in real time. They traced 50 real attacks from 2022 to 2025 that cost more than $1.09 billion combined, against a catalog of 24 active vulnerability classes drawn from 71 academic papers. Most of that billion dollars didn't come from a single isolated bug — it came from exploit chains: protocol-logic flaws, governance and lifecycle issues, and external dependencies combining with an implementation bug, rarely any one of those alone.
Academic vulnerability research, the authors note, still mostly studies implementation bugs — the last item on that list. Protocol-logic flaws, governance and lifecycle issues, and external dependencies — the other three — are where the money actually goes.
04 Understanding What's Exploited
The Perez-and-Livshits result says presence and exploitation are different distributions. It stops short of saying just how different — for that you need actual exploitation data, gathered more than one way. Two more sources, using two different methodologies, land close enough to the same number that it stops looking like an artifact of any one analyst's assumptions.
Two Convergent Measurements
- VulnCheck's count. Caitlin Condon and the VulnCheck 2026 Exploit Intelligence Report tracked exploitation directly rather than modeling it: more than a quarter (26%) of CVEs with 2025 identifiers had public PoC code or exploit details by year's end, yet just 1% of everything disclosed in 2025 was ever confirmed exploited in the wild — even as disclosures, PoC code, and AI-generated exploit tooling all surged in parallel. The gap cuts the other way too: 28.96% of the CVEs VulnCheck confirmed exploited in 2025 were already under attack on or before their CVE's publication date, up from 23.6% the year before — for the vulnerabilities that do turn out to matter, the remediation clock has often already run out before defenders even learn the CVE exists. VulnCheck added 884 vulnerabilities to its own KEV dataset that year, and separately maintains a list of the 50 most routinely targeted vulnerabilities — the same handful of entry points attackers keep reaching for, which is exactly the attacker-economics pattern the breach data below confirms.
- EPSS's model. FIRST.org's Exploit Prediction Scoring System (EPSS) takes the opposite approach from CVSS: instead of a static severity score, it assigns every CVE a continuously updated probability that it will be exploited in the next 30 days. Run against CVSS in practice, the gap is stark — Picus Security's analysis found only about 2.3% of CVEs scored CVSS 7 or above have ever actually been observed under exploitation. That's the mirror image of the CVSS problem the breach data surfaces next: CVSS doesn't just miss most of what gets exploited, it also flags almost everything that doesn't.
Two different measurement approaches — one an exploit-tracking census, one a machine-learned probability model — converging on a single-digit percentage is about as strong as evidence gets in this argument: not one team's methodology, but the same signal recovered independently.
The Prioritization Triad
If raw volume is a distraction and discovery keeps accelerating, the honest answer is to stop measuring the wrong thing. The shift is from volume-based remediation to evidence-based risk reduction, and it rests on three signals working together, not any one of them alone:
Threat intelligence and breach data (is this being exploited, right now, anywhere) meets organizational context (does this asset matter, and is it reachable from outside) meets dynamic reachability (can you build a working proof-of-concept against my deployment, not just trace that the code path executes). A CVE that fails any one of the three doesn't get to jump the queue just because its CVSS score is high.
- Threat intelligence and breach data. Prioritize vulnerabilities with demonstrated, active in-the-wild exploitation — CISA's KEV catalog and breach tracking — over theoretical CVSS predictions.
- Organizational context and exposure. Weigh asset value, network position, and internet reachability before assigning priority. An unpatched edge VPN is immediate exposure; an isolated internal utility library is not.
- Dynamic reachability analysis. Confirm that a vulnerable code path actually executes in your specific stack — runtime tracing, taint analysis, and sandboxed testing all count as evidence, and a working proof-of-concept exploit is simply the strongest form that evidence can take — before spending engineering time on it.
The Limits of Threat Intelligence Alone
That first leg, alone, isn't enough — EPSS is the clearest illustration of why. Splunk's Muhammad Raza credits its breadth, more than a thousand input variables, with letting it outperform CVSS at separating signal from noise. The score is meant to be read literally, not just ranked: ReversingLabs' John P. Mello Jr. explains that a 90% EPSS score means roughly nine in ten CVEs rated that way actually get exploited, a calibration claim EPSS's own maintainers back with a recommended action threshold of 0.36; below that, a CVE isn't supposed to jump the queue.
Independent researcher Rianna Parla tested that threshold against reality.
Of 250 CVEs added to CISA's KEV catalog during her study period, more than two-thirds sat below 0.36 the day before inclusion — the opposite of what the threshold is supposed to catch.
Narrowed to the 57 most recent entries, 42 carried a consistently low, mostly single-digit score right up to confirmed exploitation; four were added to KEV the same day they were disclosed, already under attack before EPSS had a chance to say anything at all.
One case makes the trailing-indicator problem concrete on its own: CVE-2020-17519, an Apache Flink path-traversal flaw, has carried a 90% EPSS score continuously since the model's third version launched in March 2023 — a confident, correct-looking call, until Palo Alto Networks' Unit 42 incident data places the real exploitation window at November 2020 to January 2021, more than two years before the model that's "predicting" it even existed.
Parla's wider sample shows the same shape: CVEs from 2022 or earlier almost universally score high before their KEV listing, while CVEs from 2023 onward — the ones a defender would actually need a forecast for — turn in "mixed-to-poor" results. A model that looks sharp in hindsight and blurry in the moment it matters is describing the past, not forecasting the future.
Global Signal, Local Risk
The other gap is exactly the triad's second leg: EPSS scores the whole internet, not your environment. Kodem's Mahesh Babu makes the point with a concrete case: CVE-2024-34341, a cross-site-scripting flaw in the Trix editor, scored around 20% — comfortably below any reasonable cutoff — yet was a critical risk in internet-facing deployments with privileged users, a distinction EPSS's global average has no way to see. His framing: EPSS is a weather forecast for the whole region, not a report on whether your street floods.
None of this makes EPSS worthless. It's a genuine improvement on CVSS's static severity score, and the IsMalicious team notes its daily update cycle catches newly weaponized CVEs within 24 hours of exploit code surfacing. It's simply not the standalone predictor its name promises — which is the whole argument for treating it as one leg of three, not the entire strategy.
Root Evidence's own Robert "RSnake" Hansen reaches the identical conclusion from the other direction, and cites FIRST's own guidance to back it: EPSS "is best used when there is no other evidence of active exploitation," and where such evidence exists, it "should supersede the EPSS estimate." Hansen's target is the reverse ordering some teams propose — EPSS first, KEV lists second — which he points out has no coherent stopping rule once you notice EPSS and KEV both cover the same 300,000-plus CVEs. Evidence of actual exploitation, not a probability estimate of it, is supposed to lead. That's the same argument from earlier in this post, restated by a vendor that sells the opposite of what EPSS sells.
Speed still matters — the report isn't wrong about that. But a 24-hour remediation cycle aimed at the 1.4% of vulnerabilities carrying real exploitable risk protects an organization far more than 90 days spent clearing thousands of flaws nothing can ever reach.
05 What Actually Mattered in Q1 2026
A third, independent data source makes the same case again, this time from breach outcomes rather than theory.
The Q1 2026 Report
For a third cut at the same question — this one built directly on breach data rather than tracked exploits or predicted probabilities — look at Root Evidence's Q1 2026 analysis, Stop Counting CVEs: What Actually Mattered in Q1 2026.
Founded by longtime security researchers Robert Hansen, Jeremiah Grossman, Heather Konold, and Lex Arquette, Root Evidence ran publicly available vulnerability data through a real-world breach lens instead of a severity score.
| Category | Count | Share |
|---|---|---|
| Total analyzed CVEs | 352,357 | 100.0% |
| Known exploited vulnerabilities | 4,920 | 1.4% |
| Unexploited in the wild | 347,437 | 98.6% |
The findings cut hard against volume-driven panic:
- The 1.4% rule. Only 1.4% of indexed CVEs (~4,920 of 352,357) have ever been confirmed exploited in a real breach. Over 98% of recorded vulnerabilities have caused zero breach impact, full stop.
- The CVSS flaw. 63.5% of known exploited vulnerabilities carry a CVSS score below 9.0 — the mirror image of the EPSS gap above. A team that only works "CVSS Critical" tickets is systematically missing roughly two out of three vulnerabilities that attackers are actually using.
- Uncorrelated proxies. Public proof-of-concept availability correlates with real breach occurrence at only 2.4–4.4%. Over 80% of actively exploited CVEs (80.55%) have no corresponding Metasploit module at all. The signals most teams triage by aren't the signals that predict exploitation.
- Attacker economics. Adversaries don't abandon a working exploit chain just because AI hands them fresh zero-days. They keep going after cheap, reliable, scalable entry points — edge devices, VPNs, firewalls, client-side software, known command-injection flaws — because those still work.
Under 0.2%
Root Evidence followed the Q1 report with a companion post, "Why We Built the Evidence Platform," that cuts the same data even harder. Running cyber insurance claims and incident-response data against the full CVE population — more than 370,000 published, 40,000 to 60,000 new every year — turned up fewer than 600 CVEs ever tied to an actual financial loss.
That's under 0.2%, an order of magnitude tighter than the 1.4% exploited figure above, because it asks a stricter question: not just exploited, but exploited enough to cost someone money. You would never go to Vegas with those odds.
Betting on It: The Mythos Warranty
The company backs that number with a bet of its own: the Mythos Warranty — unrelated to Anthropic's Claude Mythos despite the shared name — reimburses customers up to $5 million for losses tied to any CVE Root Evidence failed to flag, underwritten by cyber insurers who reviewed the same breach data. A vendor's confidence in a prioritization method means more when it's backed by real money than by a press release.
Cyber insurance is the right place to look for this kind of signal, because the market has already been forced through a version of the same reckoning this post describes.
The Insurance Market's Own Blind Spot
It's a roughly $23 billion line of business growing near 15% a year, and underwriters have been moving away from annual paper questionnaires toward continuous telemetry: Coalition and At-Bay both price and monitor policies off live signals — external attack-surface scans, MFA and EDR deployment status, and increasingly the kind of exploitation data cited throughout this post.
But most of that market still leans on the same blunt instrument this post has argued against throughout. A large share of cyber policies now carry a "known vulnerability" or failure-to-patch exclusion: if a breach traces back to a CVE that was publicly disclosed and patchable months earlier, the insurer can decline the claim outright.
Over 40% of cyber claims now get denied, and exclusions like this one are the leading reason. The insurance industry, in other words, has its own CVE-counting problem — just measured in payouts instead of remediation hours.
That's what makes the Mythos Warranty notable beyond the marketing. Standard exclusions penalize a customer for any unpatched CVE that existed, reachable or not.
06 Business Imperatives and Policy Solutions
Closing the gap between the two clocks takes action on both the corporate and the government side — but the throughline in every recommendation below is still prioritization, not raw speed. J.P. Morgan's report is more useful here than in its headline framing — the recommendations are concrete.
Enterprise Action Items
- Dependency rationalization. Move off unmaintained, single-maintainer packages before they become the reachable path an attacker actually uses.
- Optimized change management. Streamline testing pipelines so a targeted hotfix can ship without waiting for a full release cycle — the 90-day remediation drag is a process problem as much as a technical one.
A third lever works differently from the first two: predictive triage. KEV and breach data both look backward — something has to have already happened before either can flag it. Suciu et al.'s Expected Exploitability research (see Related Work) shows a calibrated model predicting whether a functional exploit will ever get built, rather than waiting for one to show up, can lift precision from 49% to 86% over baseline classifiers. Feed a model like that into the threat-intelligence leg of the triad above as a forward-looking supplement to prioritization — not as a replacement for confirmed exploitation evidence or reachability.
The fourth lever, for legacy operational technology (OT), is the hardest case: OT defense. It can't always take a patch — up to 30% of it, running on 10-to-18-year hardware, can't accept one at all — so compensating controls (segmentation, monitoring, anomaly detection) have to stand in instead. The catch, below, is that most operators can't see their network well enough for those controls to work.
Government and Policy Mechanics
- Vulnerability clearinghouses. Initiatives like the Gold Eagle Initiative, established under EO 14409, stage patch disclosures to verified critical-infrastructure operators ahead of public release — giving defenders a head start before reverse-engineering begins in earnest.
- Information-sharing reauthorization. Keeping legal liability protections in place for private-sector threat sharing, under mechanisms like the Cybersecurity Information Sharing Act, keeps cross-industry threat communication moving at something closer to the attacker's speed.
Because so much critical infrastructure is privately owned, neither lever — government disclosure programs, or enterprise action on them — works alone. Enterprises without a clearinghouse feed are triaging blind; a clearinghouse with no enterprise capacity to act on it just moves the bottleneck upstream.
07 Related Work
The presence-versus-exploitation gap this post keeps returning to has its own research lineage, stretching back well before EPSS existed. Six papers, spanning several different measurement approaches, are worth setting down explicitly — in roughly the order the field tackled them.
Zero-days, measured in the field. Bilge and Dumitraș's "Before We Knew It" (ACM CCS 2012) is the paper that put a number on how long a zero-day actually survives before disclosure: field telemetry from 11 million real hosts turned up 18 true zero-day attacks, running a median of 8 months and an average of roughly 10 months before anyone noticed — a much slower clock than the "under a day" figures this post's own charts are built on, and a reminder that the collapsing-TTE story is specifically about disclosed, not undiscovered, vulnerabilities.
Twitter as a leading indicator. Sabottke, Suciu, and Dumitraș's "Vulnerability Disclosure in the Age of Social Media" (USENIX Security 2015) predates EPSS by five years and reaches a similar structural conclusion from a completely different signal: a CVSS-only baseline classifier tops out under 9% precision, and folding in Twitter chatter about a CVE measurably improves on it — an early demonstration that the static severity score alone was never going to be enough.
The original EPSS paper. Jacobs, Romanosky, Adjerid, and Baker's "Improving Vulnerability Remediation Through Better Exploit Prediction" (Journal of Cybersecurity, 2020) is the methodology this entire post's EPSS discussion assumes but never names directly: 75,000+ CVEs from 2009–2018, real exploit observations from roughly 100,000 monitored corporate networks, and a gradient-boosted model that reaches 70% coverage of exploited vulnerabilities by patching about 7,900 CVEs — versus 30,000 to 34,000 under a CVSS- or exploit-count-based strategy.
The same author, seven years later. Suciu, Nelson, Lyu, and Bao's "Expected Exploitability" (USENIX Security 2022) continues the line the Twitter paper started, now predicting whether a functional exploit will ever get built, not just whether one shows up on social media. Across 103,137 vulnerabilities, their metric lifts precision from 49% to 86% over prior classifiers — and the paper opens with CVE-2017-0144, the flaw WannaCry and NotPetya weaponized, sitting outside every expert patch-priority list right up until it wasn't.
OT/ICS gets its own scoring model. Yoon, Kim, Kim, and Euom's "Vulnerability Exploitation Risk Assessment Based on Offensive Security Approach" (Applied Sciences, 2023) makes the case this post's own OT material only gestures at: standard vulnerability assessment doesn't transfer to industrial control systems, so the authors build a dedicated OT/ICS risk score from exploit-chain risk, exploit-code availability, and exploit-use probability — for exactly the kind of environments Dragos tracks earlier in this post.
The weakness-type version of the same question. Mell, Bojanova, and Galhardo's "Measuring the Exploitation of Weaknesses in the Wild" (2024) runs the presence-versus-exploitation test one level up, at the CWE weakness-class level rather than the individual CVE: across 130 weakness types tracked from April 2021 to March 2024, 92% were not being constantly exploited — the same shape of answer this post keeps finding, recovered again at a different unit of analysis.
Read together, they cut against the same instinct from six different directions and three different eras: a static severity score was never going to predict exploitation, whether the signal added instead is social media chatter, field telemetry, a machine-learned model refined over a decade, or a domain-specific score built for hardware that can't be patched at all.
08 Open Questions
The argument above is that disclosed-volume panic overstates enterprise risk — not that the underlying capability is staying confined. The Patchmageddon report spends five pages on the part of its thesis this post has given the least weight, and that part is the one that holds up best.
Epoch AI estimates freely downloadable open-weight models now lag the leading proprietary frontier by roughly three months, not years; Kimi K3 has already reached cyber parity with Anthropic's and OpenAI's frontiers in J.P. Morgan's own testing, at roughly half the per-task cost. And once a model of that class is downloadable, guardrails are removable — a tool called Heretic strips safety protections from open-weight systems in under ten minutes on a laptop, and a jailbroken Z.ai GLM 5.2 has been circulating on Hugging Face since June.
This critique says most CVEs don't matter; it does not say capability won't democratize. Both can be true, and the second is the reason prioritization matters more, not less.
With that on the table, the picture above is solid on where the field has been and less settled on where the actual boundary of AI-driven offense and defense sits right now — and that boundary is mostly being tested in working papers, not asserted in press releases — most of them sitting on arXiv rather than in a peer-reviewed venue yet. Seven recent ones are worth flagging.
RQ1: Exploitation Capability
ExploitGym (Wang, Schiller, Li, et al., 2026) benchmarks AI agents against 898 real vulnerability instances instead of counting CVEs, and even frontier models fall short of the machine-speed narrative once forced to produce a working exploit: Claude Mythos Preview and GPT-5.5 succeeded on 157 and 120 instances respectively — a "non-trivial fraction," in the authors' words, not a majority.
Is that ~18% success rate a ceiling imposed by something structural in the exploit-construction task, or a snapshot of where the frontier happens to sit today — the 2024 model evaluated against a 2026 benchmark, with the next generation already training?
RQ2: Triage Economics
OpenAnt (Korda & Evron, 2026) operationalizes the reachability filter from earlier in this post directly: it decomposes a codebase into units filtered by reachability from external entry points before running deeper analysis, cutting the search surface by up to 97%. The largest repository runs in the paper still cost several hundred dollars each.
Does that cost curve bend down fast enough to matter at ecosystem scale, or does reachability-gated triage stay a boutique technique?
RQ3: Slop Sustainability
A July 2026 study of GitHub contribution data — "AI Slop is DDoSing Open Source" (Afroz, Miller, Menezes, Gilmour, Sarma & Feng) — found pull-request volume rising through 2025 while merge rates fell, with first-time contributors seeing an 18% drop against projections: the maintainer side of the triage-overload problem raised in Frontier AI and Machine-Speed Discovery.
Do better filtering tools arrest the merge-rate collapse, or does volunteer maintenance simply not survive contribution at this volume?
RQ4: Fabricated Exploits in the Wild
VulnCheck's 2026 Exploit Intelligence Report documents AI-generated PoC repositories that look functional but never exercise the claimed vulnerability — including a fake "working" React2Shell exploit that cost defenders real investigation time, and a fabricated CVE attribution that Google's AI search summaries then repeated as fact, citing the fabricated repository as its source.
When one AI system's fabrication becomes another's ground truth, does confirmation need more automation — or a human, specifically because the automation is what's being fooled?
RQ5: The Confirmation Bottleneck
If discovery is automated and reachability filtering helps, the next chokepoint is confirmation — something still has to verify a flagged report is a real, working exploit rather than a static-analysis false positive. AXE (Sajadi, Nguyen, Damevski & Chatterjee, 2026) automates that step and gets a working proof-of-concept on 30% of its benchmark — three times better than prior black-box approaches, and still well under a third.
Can automated confirmation keep pace with automated discovery, or does it just relocate the bottleneck?
RQ6: Benchmark Validity
CAIBench (Sanz-Gómez, Mayoral-Vilches, Balassone, et al., 2026), a meta-benchmark spanning more than 10,000 offensive and defensive test instances, found models saturating on cybersecurity knowledge questions (~70%) while dropping to 20–40% on multi-step adversarial scenarios. Knowing what a vulnerability is and being able to exploit or defend one are different capabilities — which raises a question about every "frontier model found N zero-days" headline, including the ones cited earlier here.
Do those "N zero-days found" headlines measure actual offensive capability, or only textbook recall?
RQ7: Small Models, System Edge
The Antares and Gemini 3.5 Flash Cyber results cited earlier point at a structural question that none of the benchmarks above resolves: if a 3-billion-parameter model matches frontier-level localization accuracy at 1/141st the cost, and the durable edge is the orchestration system wrapped around the model rather than the model itself — as a recent post on small language models argues — then the frontier's advantage narrows to the slice of the task that still needs raw scale. The open question is whether that slice shrinks as orchestration matures, or whether multi-step exploit chains and long-horizon reasoning stay a frontier-only zone regardless of how good the surrounding tooling gets.
Does the small-model-plus-orchestration edge hold as the task gets harder, or does multi-step exploitation pull back toward frontier scale?
09 Conclusions
J.P. Morgan's Patchmageddon does the industry a service by putting numbers behind a shift that's been visible anecdotally for a year: AI-driven vulnerability discovery is real, the collapse in time-to-exploit is real, and the old ninety-day disclosure cadence describes a world that no longer exists. What hasn't changed is that prioritization, not raw speed, is what determines whether any of this ends up mattering to a given organization.
Panic is not a strategy.
The empirical reality — Perez and Livshits on uneven exploitation rates, Root Evidence on breach data, Parla's direct test of EPSS against confirmed exploits — is that risk stays highly concentrated even as raw volume explodes.
Over 98% of disclosed vulnerabilities never lead to a breach, and the attackers who do get in keep relying on the same familiar, unpatched, exposed entry points they always have.
The pragmatic summary:
- Acknowledge the discovery. Machine-speed vulnerability discovery is real — J.P. Morgan is right about this.
- Reject volume panic. "Patch everything, faster" is not a strategy.
- Anchor in reachability. Prioritize on reachability and KEV data, not CVSS or EPSS scores alone.
- Execute what's reachable. Point rapid remediation at the high-context exposures that are actually reachable.
- Layer in prediction. Where nothing has been confirmed exploited yet, a calibrated forward-looking model — Suciu et al.'s functional-exploit predictor, not CVSS and not EPSS alone — adds real signal on top of reachability and KEV data, not in place of them.
The organizations that come out ahead in the exploitation era won't be the ones trying to patch all 48,000 CVEs disclosed this year. They'll be the ones that adopt evidence-based prioritization, measure dynamic reachability, and point their rapid-response capacity at the vital minority of flaws — something under 2% of the total — that actually drive enterprise risk. Everything else is potentially expensive noise, however fast the machine generating it has gotten.
References
- Cembalest, M., Opet, P., et al. (2026). Patchmageddon: The race to patch software vulnerabilities before zero-day cyber-exploitations proliferate. J.P. Morgan Asset & Wealth Management, Eye on the Market (July 2026). Available at: am.jpmorgan.com
- Epp, S. Zero Day Clock — live time-to-exploit dashboard. Available at: zerodayclock.com
- Mitiga. (2026). "Agentic Runtime Security: When Patching Can't Keep Up." Available at: mitiga.io
- Anthropic. (2026). "Project Glasswing: An Initial Update." Anthropic Research (May 2026). Available at: anthropic.com
- OpenAI. (2026). "Daybreak: Tools for Securing Every Organization in the World." Includes GPT-5.5-Cyber evaluation results. Available at: openai.com
- UK AI Security Institute (AISI). (2026). "Measuring AI Agents' Progress on Multi-Step Cyber Attack Scenarios." Available at: aisi.gov.uk
- Perez, D. & Livshits, B. (2021). "Smart Contract Vulnerabilities: Vulnerable Does Not Imply Exploited." Proceedings of the 30th USENIX Security Symposium. Available at: usenix.org
- Hu, T., Li, J., Li, B., & Storhaug, A. (2024). "Why Smart Contracts Reported as Vulnerable Were Not Exploited?" IEEE Transactions on Dependable and Secure Computing. Preprint available at: techrxiv.org
- Rezaei, H., Eshghie, M., et al. (2025). "SoK: Root Cause of $1 Billion Loss in Smart Contract Real-World Attacks via a Systematic Literature Review of Vulnerabilities." Available at: arxiv.org
- Condon, C., et al. (2026). 2026 VulnCheck Exploit Intelligence Report. VulnCheck. Available at: vulncheck.com
- FIRST.org. Exploit Prediction Scoring System (EPSS). Available at: first.org/epss
- Picus Security. (2026). "Vulnerability Prioritization in 2026: Why CVSS Isn't Enough." Available at: picussecurity.com
- Parla, R. (2024). "Efficacy of EPSS in High Severity CVEs found in KEV." arXiv:2411.02618. Available at: arxiv.org
- Raza, M. (2026). "Exploit Prediction Scoring System (EPSS): How It Works and Why It Matters." Splunk. Available at: splunk.com
- Mello, J. P., Jr. (2023). "EPSS vs. CVSS: Exploit Prediction Could Move the Needle on Software Risk." ReversingLabs. Available at: reversinglabs.com
- Babu, M. (2025). "EPSS vs. Exploitability: Why Probability ≠ Risk in Your Environment." Kodem. Available at: kodemsecurity.com
- IsMalicious Team. (2026). "EPSS Explained: Using the Exploit Prediction Scoring System to Prioritize Patches in 2026." Available at: ismalicious.com
- Hansen, R., Grossman, J., Konold, H., & Arquette, L. (2026). "Stop Counting CVEs: What Actually Mattered in Q1 2026." Root Evidence Report. Available at: rootevidence.com/report
- Root Evidence. (2026). "Why We Built the Evidence Platform." Available at: rootevidence.com
- Hansen, R. (2025). "Evaluating EPSS as a Primary Vulnerability Prioritization Tool." Root Evidence. Available at: rootevidence.com
- Coalition. (2026). 2026 Cyber Claims Report. Available at: coalitioninc.com
- At-Bay. (2026). 2026 InsurSec Report. Available at: at-bay.com
- The Cyber Express. (2026). "Cyber Insurers Might Not Pay if Vulnerabilities Unpatched," citing Coalition's exclusion analysis. Available at: thecyberexpress.com
- Sonatype. (2026). 2026 State of the Software Supply Chain. Available at: sonatype.com
- Forescout Technologies. (2026). "ICS Cybersecurity in 2026: Vulnerabilities and the Path Forward." Available at: forescout.com
- Dragos. (2026). 2026 OT/ICS Cybersecurity Report and Year in Review. Available at: dragos.com
- Jacobs, J., Romanosky, S., Adjerid, I., & Baker, W. (2020). "Improving Vulnerability Remediation Through Better Exploit Prediction." Journal of Cybersecurity, 6(1), tyaa015. Available at: academic.oup.com
- Sabottke, C., Suciu, O., & Dumitraș, T. (2015). "Vulnerability Disclosure in the Age of Social Media: Exploiting Twitter for Predicting Real-World Exploits." Proceedings of the 24th USENIX Security Symposium. Available at: usenix.org
- Suciu, O., Nelson, C., Lyu, Z., & Bao, T. (2022). "Expected Exploitability: Predicting the Development of Functional Vulnerability Exploits." Proceedings of the 31st USENIX Security Symposium. Available at: usenix.org
- Bilge, L. & Dumitraș, T. (2012). "Before We Knew It: An Empirical Study of Zero-Day Attacks in the Real World." Proceedings of the 2012 ACM Conference on Computer and Communications Security. Available at: dl.acm.org
- Mell, P., Bojanova, I., & Galhardo, C. (2024). "Measuring the Exploitation of Weaknesses in the Wild." arXiv:2405.01289. Available at: arxiv.org
- Yoon, S.-S., Kim, D.-Y., Kim, K.-K., & Euom, I.-C. (2023). "Vulnerability Exploitation Risk Assessment Based on Offensive Security Approach." Applied Sciences, 13(22), 12180. Available at: mdpi.com
- Emberson, L. (2025). "Open-Weight Models Lag State-of-the-Art by Around 3 Months on Average." Epoch AI. Available at: epoch.ai
- Wang, Z., Schiller, N., Li, H., et al. (2026). "ExploitGym: Can AI Agents Turn Security Vulnerabilities into Real Attacks?" Available at: arxiv.org
- Korda, N. & Evron, G. (2026). "OpenAnt: LLM-Powered Vulnerability Discovery Through Code Decomposition, Adversarial Verification, and Dynamic Testing." Available at: arxiv.org
- Afroz, S., Miller, C., Menezes, T., Gilmour, E., Sarma, A., & Feng, Z. (2026). "'AI Slop is DDoSing Open Source': Understanding the Impact of AI-Generated Contributions on Open Source Sustainability." Available at: arxiv.org
- Sajadi, A., Nguyen, T., Damevski, K., & Chatterjee, P. (2026). "AXE: Grey-Box Exploitability Confirmation for Localized Vulnerability Reports." Available at: arxiv.org
- Sanz-Gómez, M., Mayoral-Vilches, V., Balassone, F., et al. (2026). "CAIBench: A Meta-Benchmark for Evaluating Cybersecurity AI Agents." Available at: arxiv.org